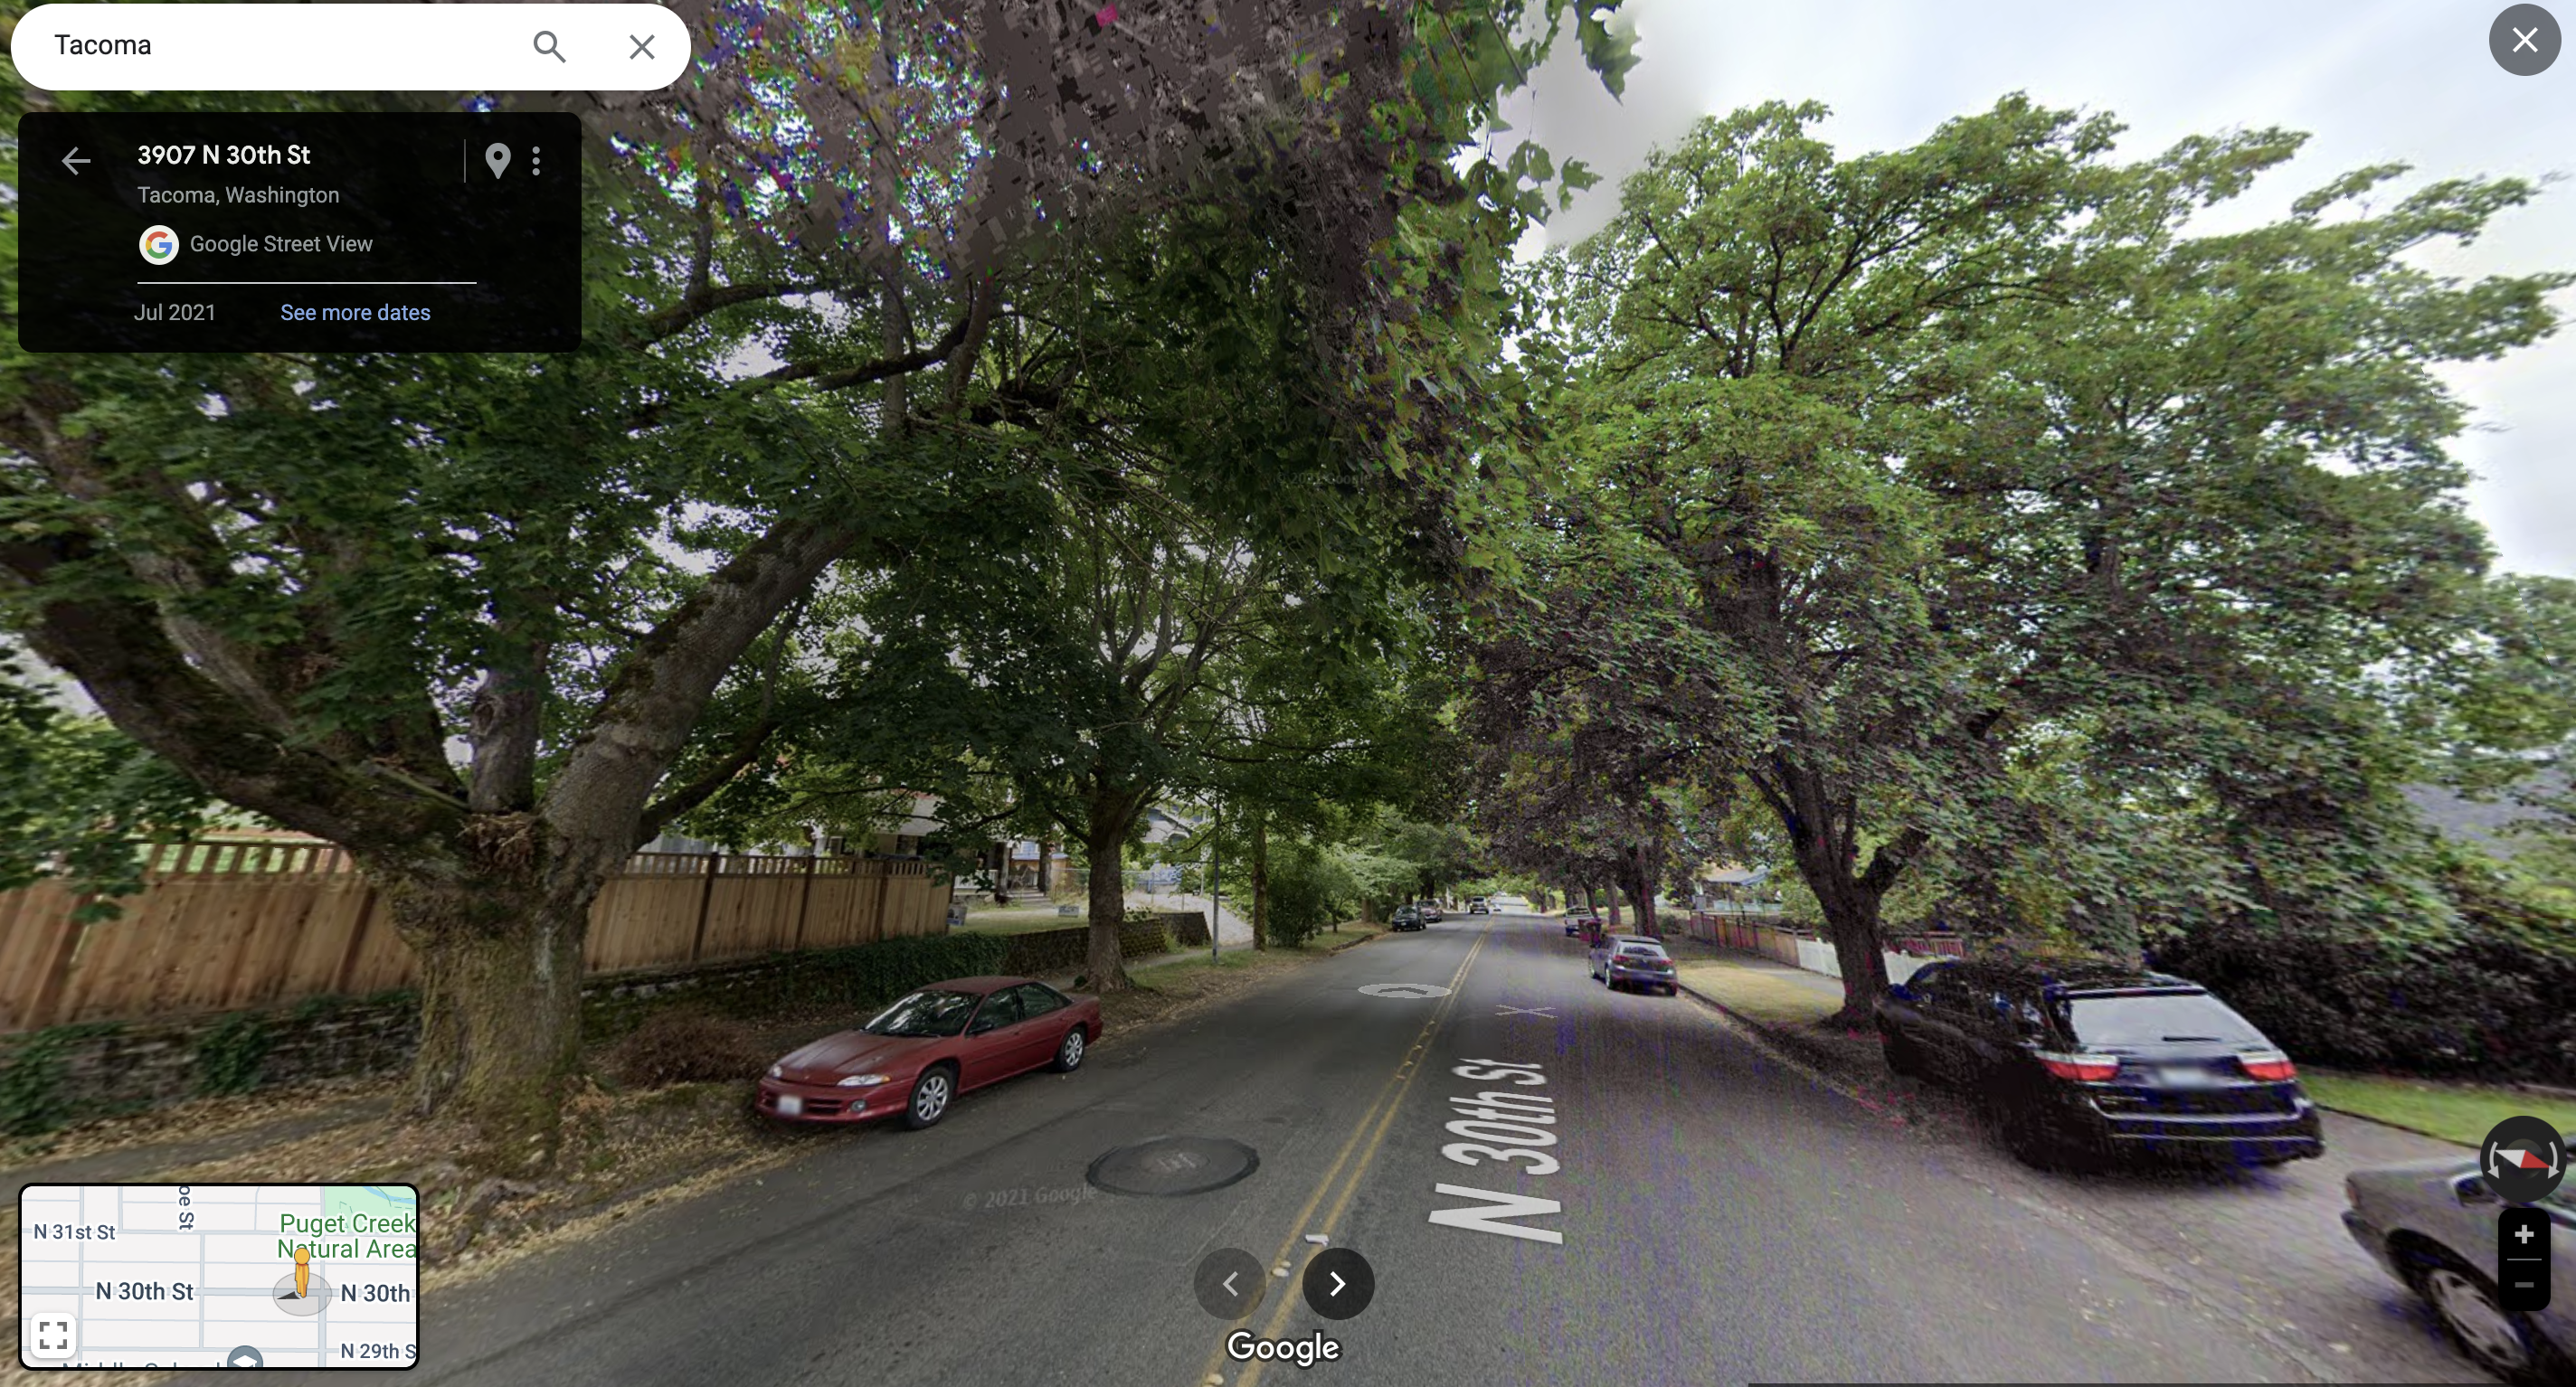
Redfin reported that only 21% of American houses sold in 2022 were affordable. 79% were unaffordable. The median home price is now $431,000, which is up more than 100% from the Great Recession lows of 2009. Compare that to the rate of inflation, which has (*only*) been around 44% during that same period.
There’s no other period in US history where housing prices have outpaced inflation so dramatically. What the hell is going on?
A lack of housing supply is responsible for high housing prices
Everyone has heard of supply and demand. Prices go up when lots of buyers want something that’s in scarce supply. On the flip side, prices go down when there’s a large supply and fewer buyers. This is the most basic and fundamental economic principal.
When it comes to housing, there’s not much supply right now, but a lot of demand. Freddie Mac estimates that “as of the fourth quarter of 2020, the U.S. had a housing supply deficit of 3.8 million units.”
In 2023, there were
Why haven’t we been building more housing?
Building housing isn’t easy. There are two factors that have caused the housing industry to severely under-build for the last 15 years or so: (1) NIMBYs, and (2) the Great Recession.
Racist NIMBYs
The term “NIMBY” stands for “Not In My Back Yard.” Basically, NIMBYs are activists who don’t want new development or change in their neighborhoods.
American NIMBYism was founded in racism. Dating back to the mid 1800s, NIMBYs kept minorities out of white neighborhood through restrictive covenants and redlining. Restrictive covenants explicitly prohibited the sale of property to minority owners. Redlining prohibited lenders from lending money to minority neighborhoods. In combination, these housing policies kept cities segregated, and minority neighborhoods poor for more than a hundred years.
In the 1950s, NIMBYs created the first zoning laws. Some of the earliest zoning laws required that all housing in a neighborhood be single-family homes. What’s a “single-family home”? Think the traditional suburban home with a front yard, backyard, and white picket fence. Here’s a helpful graphic showing single-family housing on the far left–the least dense housing type:
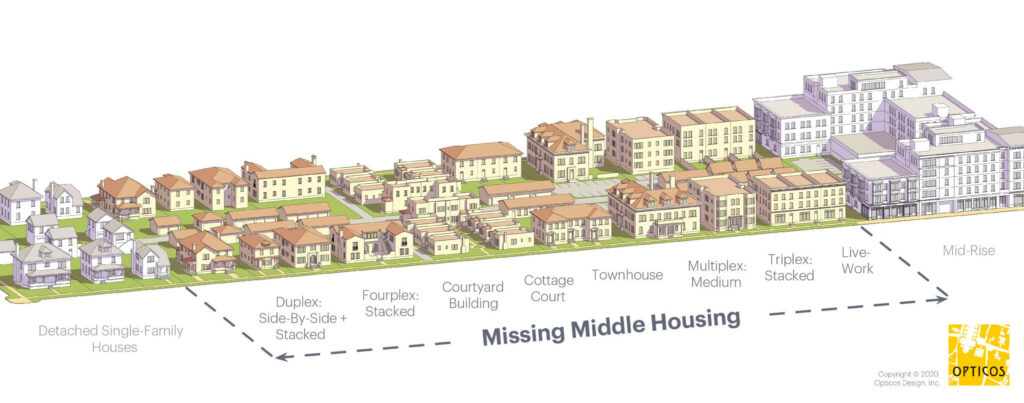
Single-family housing is the least efficient housing type. It allows one dwelling unit per 6,000 square foot lot. Due to the inefficient use of land, housing in these restricted neighborhoods is inherently more expensive than housing in neighborhoods with apartments, townhomes, or even duplexes.
The extent of these restrictions is hard to overstate. Until 2024, about 80% of Tacoma’s residential property was restricted to single-family housing. All of the yellow/beige areas were single-family only:
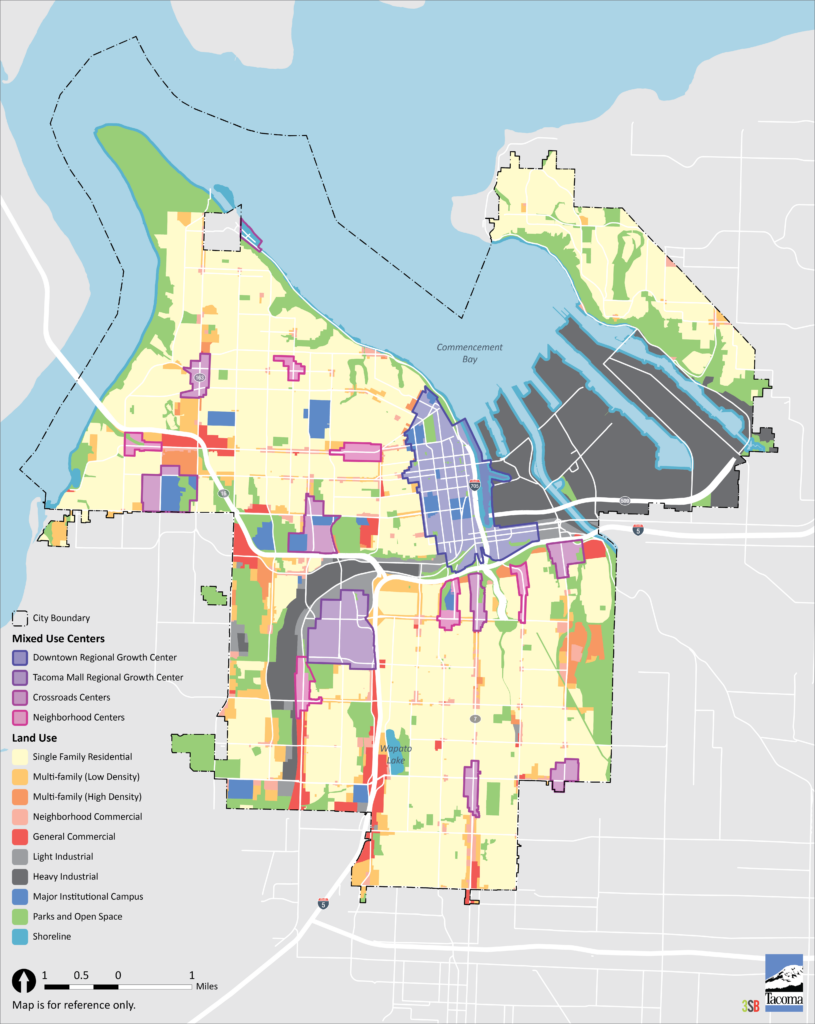
It’s no wonder housing is so unaffordable when so much of the city is dedicated to the least efficient housing type.
Today, xenophobic NIMBYs are more careful in their advertising. For example, many residents of Tacoma’s wealthy North End are actively trying to restrict denser redevelopment for the sake of preserving “historic character.” They want to keep their neighborhood the way it has always been: rich and white.
Anti-displacement and anti-gentrification activists are the new generation of NIMBYs
Younger NIMBYs come to their beliefs from the opposite end of the xenophobia spectrum. Instead of freezing redevelopment in rich neighborhoods, anti-displacement and anti-gentrification activists want to freeze redevelopment in low-income neighborhoods because they incorrectly believe redevelopment drives up housing prices.

The motives of these activists are admirable, but they’re missing the big picture. Prohibiting development in low-income neighborhoods may provide an advantage for existing tenants in those neighborhoods, but at the cost of harming housing affordability city and county-wide.
To be clear, these activists aren’t completely wrong–they’re correct that redevelopment can increase prices on a given block or in a particular neighborhood. However, studies show that if you zoom out and looks at redevelopment from a citywide or countywide perspective, the average housing prices actually drop as a result of redevelopment. Why? Supply and demand. Revelopment results in more total housing. More supply means lower prices overall. Certain neighborhoods might become less affordable, but prices citywide will go down with an increase in new housing.
NIMBYs have controlled the zoning laws in American cities for well over a hundred years. As a result of their efforts, it has been difficult or impossible for developers and builder to construct affordable housing in most American cities.
Just how bad are these laws?
As I write this in 2023 from our office in Tacoma, Washington, it’s literally illegal to build anything other than one single-family house and an accessory dwelling unit (ADU) on 80% of the city’s residential land. Additionally, the City has imposed a dense maze of design, setback, utility, and other laws that make it extremely costly and complex to build even the single house currently allowed.
Fortunately, these NIMBY laws may be starting to change throughout Washington State. Effective 2024, the Washington State legislature is forcing local cities and counties to allow denser housing types per HB 1110. Tacoma is set to be the first municipality to adopt regulations in compliance with this new law, but Tacoma seems poised to make a mess of it. Stay tuned.
The 2007 Great Recession crushed the building industry for a generation
Another big factor contributing to housing unaffordability is the 2007 Housing Crash and its ripple effects. Here’s a refresher on what happened in 2007:
- Lack of regulatory oversight allowed banks to issue loans to anyone with a pulse, including lots of unqualified buyers.
- The influx of unqualified buyers created artificial demand for housing. People bought multiple homes or excessively opulent homes, driving up prices and fueling overproduction.
- To fill this demand, developers and builders built more housing. They took out bigger and bigger loans to capitalize on the artificial demand.
- Inevitably, the unqualified borrowers began defaulting on their loans. As more houses entered foreclosure, more houses entered the market, increasing supply.
- Due to the foreclosures, lenders began going out of business. The foreclosures hit the financial system much harder than it should have due to fraud and lack of regulatory oversight in the mortgage-backed securities market (tranches of bad loans were packaged up with a few good loans and marketed as safe investments to banks and pension funds, many of which went out of business).
- Lenders that survived the crash tightening up their lending criteria, meaning fewer borrowers qualified for a loan. This reduced housing demand at the same time as foreclosures were increasing the supply.
- More supply and less demand caused housing values to crash. There was an empty house on virtually every block.
- About one in twenty Americans lost their jobs.
- About half of America’s homebuilders went out of business. This figure doesn’t including related businesses, like subcontractors, engineers, suppliers, furniture stores, etc.
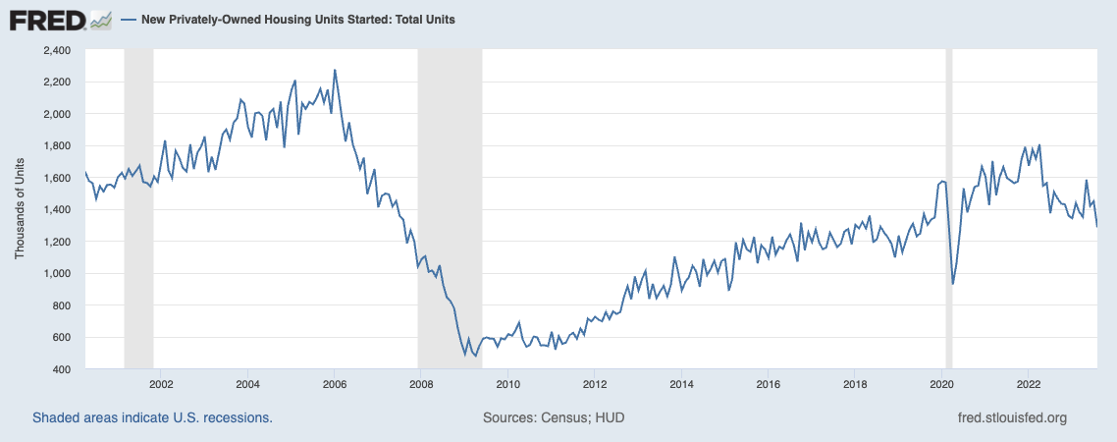
The closure of 50% of America’s homebuilders had a predictable effect. America built very little housing for the next 15 years. In fact, the rate of housing construction has never rebounded to pre-crash levels.
The following graph shows new houses under construction (called “housing starts”) from 2001-2023. Note the massive drop in housing production from 2006-2009:
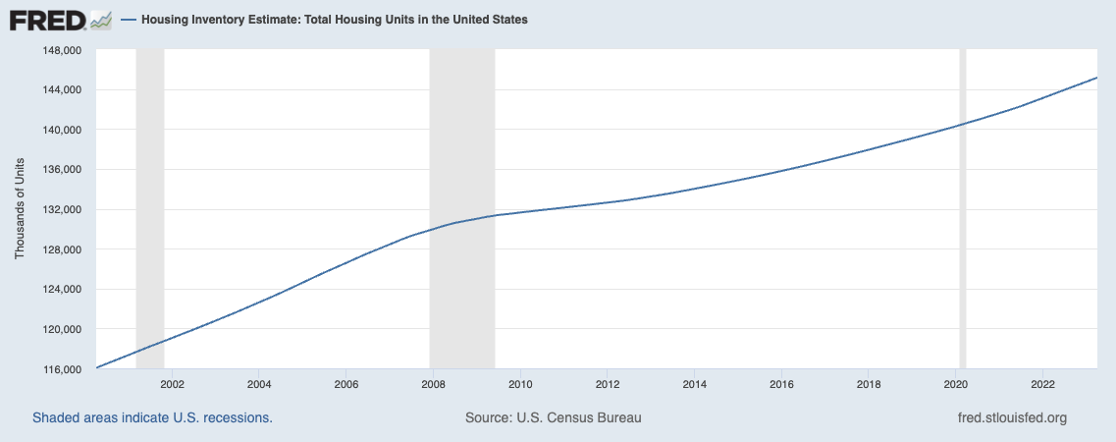
And here’s a graph of the total number of housing units in the united states from 2001-2023. Note the rapid increase in construction leading up to 2009 and then the abrupt flattening as housing construction dropped by 80%:
Meanwhile, population growth never skipped a beat. Here’s a graph of the American population from 2001-2023 reflecting a steady climb despite the crash:
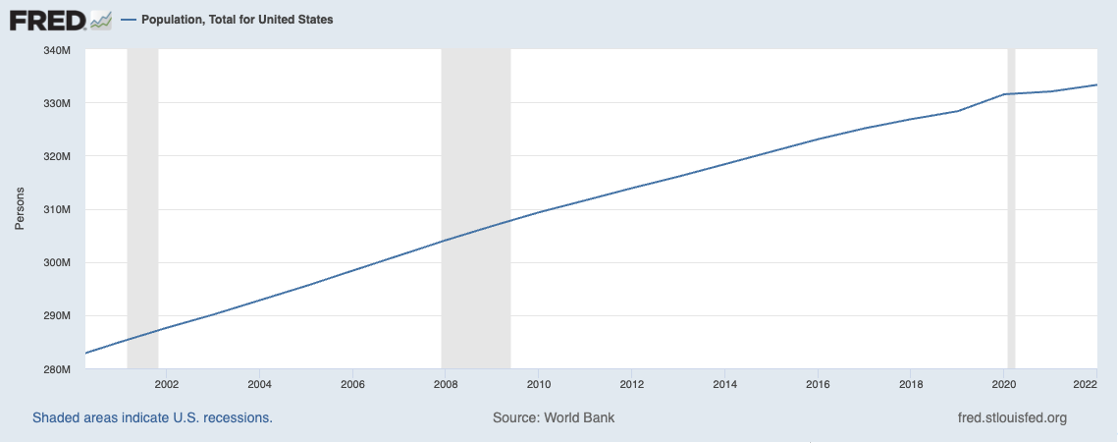
More people means more housing demand, so as our population slowly increased and the economy returned to health after the crash, demand for housing continued to increase. Fortunately, this new demand is more stable than the pre-crash demand since current demand isn’t propped up by reckless lending practices and fevered speculation.
The problem isn’t limited to the developers and builders that closed in 2007-2009. The crash undermined faith in the housing sector as a career path. As a result, an entire generation of young people have steered clear of careers in the housing industry, leaving a dearth of qualified professionals to develop and build the housing of tomorrow.
Housing prices haven’t gone down despite big interest rate increases, proving the shortage theory but adding another possible cause
As of writing this in December, 2023, the Federal Reserve has hiked the Fed funds interest rate a historic 5.25% over the last year and a half. This interest rate affects the cost for banks to borrow money, so it doesn’t perfectly correlate to the interest rate charged to the end consumer, but there’s still a strong correlation.
In 2021, the average mortgage rate was 2.65%. Today, the average rate is 7.27%. On a $400,000 home with 15% down, the monthly cost of payments (including tax and mortgage insurance) would be about 50% higher today than in 2021.
If the government were to impose a new 50% tax on, for example, new cars, you’d expect demand for new cars to fall dramatically because fewer people could afford them. To keep demand constant, retailers would (theoretically) need to lower the retail price of cars by around 50% so that potential buyers aren’t paying more than before the tax.
Puzzlingly, the price of housing has remained relatively constant despite the 50% increase in costs to consumers. How is this possible? Again, the answer is a lack of housing supply. The number of active listings (homes for sale) has cratered over the last three years from around 1.2-1.4MM houses pre-pandemic (2018-2020) to about half that number today in 2023.
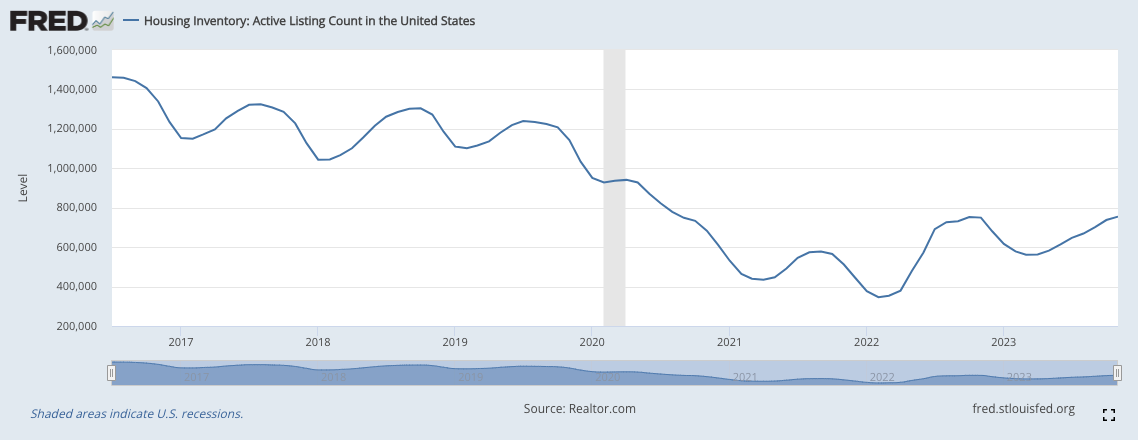
So, the real cost of housing to buyers is up around 50%, which has undoubtedly reduced demand (since fewer people can afford to buy). At a constant rate of housing supply, you’d expect housing prices to fall in response to decreased demand. However, supply is also down about 50%. Since both supply and demand have diminished in roughly equal proportion, prices have remained stable.
Why have active listings dropped so much in the last three years? NIMBYs and the 2007 Great Recession an’t the only reason–there’s probably a third factor contributing to this dramatic drop-off in new listing. Many analysts are blaming something they’ve dubbed the “mortgage rate lockdown.”
Most owners are buyers–when they sell their current house, they’re planning to buy another. The mortgage rate lockdown theory is the idea that owners who locked in a mortgage at around 2.5-3% in 2020-2022 aren’t likely to sell because they don’t want to trade their excellent rate for today’s high rates of 7%+. This lockdown effect may be even more pronounced in markets where housing values are decreasing, since owners would lose both equity and their excellent loan rate if they were to sell.
In sum, the speed of the Fed’s rate hikes has probably had a chilling effect on the housing market, dramatically reducing the number of willing sellers. However, now that the Fed has announced that it (probably) won’t be increasing rates again, we may see mortgage rates start dropping and more active listings as a result.
Honorable mentions: Housing shortage causes that didn’t make the cut
In an effort to keep things simple, we’ve noted the two major causes of the current housing shortage. However, there are some honorable mentions–each of which contribute to
- Supply chain issues during the Covid-19. The pandemic drastically affected the cost of building materials
- Magical thinking by local regulators. Sometimes it isn’t NIMBYism that motivates bad regulations; it’s just poor planning and a failure to prioritize. Local governments sometimes add too many requirements onto developments, inadvertently making it impossible to actually build.
- Putting too many costs on developers. Developers only build when they think they can make money. Local governments often try to compel developers to shoulder the costs of poor infrastructure–traffic impact fees, school impact fees, sewer impact fees, environmental impact fees, onsite stormwater infiltration (when municipal storm sewers aren’t up to the task), onsite amenity space (when there aren’t sufficient parks and recreation areas), and onsite tree coverage requirements (when municipalities can’t afford to plant trees on their own). These costs add up and make housing more expensive to the point that it sometimes doesn’t make sense to build at all.
- Lack of government funding for low-income housing. Building housing for the lowest income people often doesn’t make economic sense for for-profit developers. The only way to make these projects economically feasible is with government funding.
